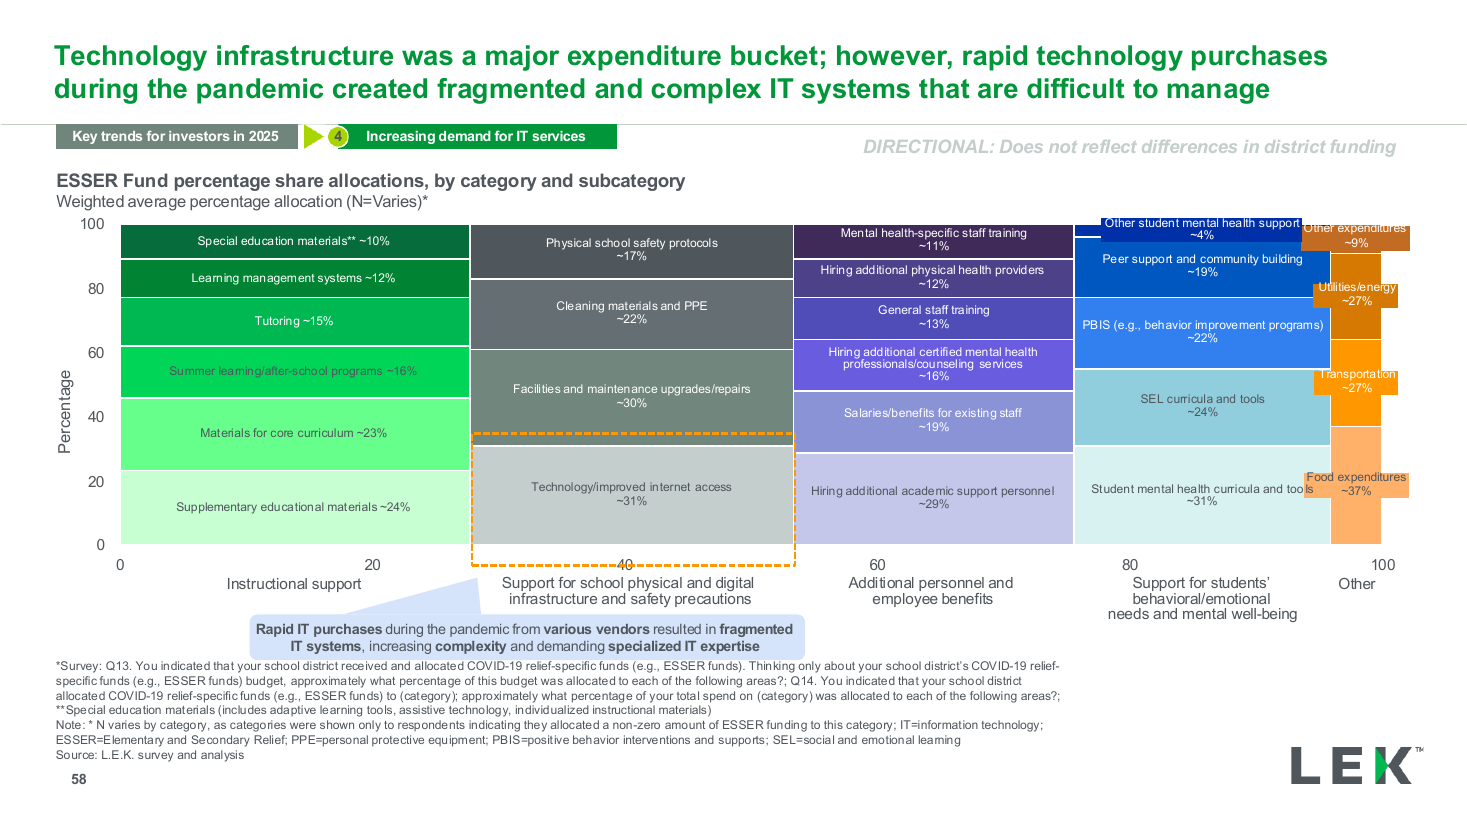
Spend allocation by category and subcategory bars slide template
A dense slide grouping horizontal bars of weighted-average spend into several category clusters, each subcategory labeled with its percentage. Use it to break a budget into categories and their line items at once.
- Horizontal bars grouped into spend categories
- Each subcategory bar labeled with a percentage
- Multiple category clusters across the slide
- Marked directional
Recreated as a native, fully editable PowerPoint slide from page 56 of Education M&A Roundup 2024 and Trends for 2025, a publicly published L.E.K. Consulting deck.
More like this
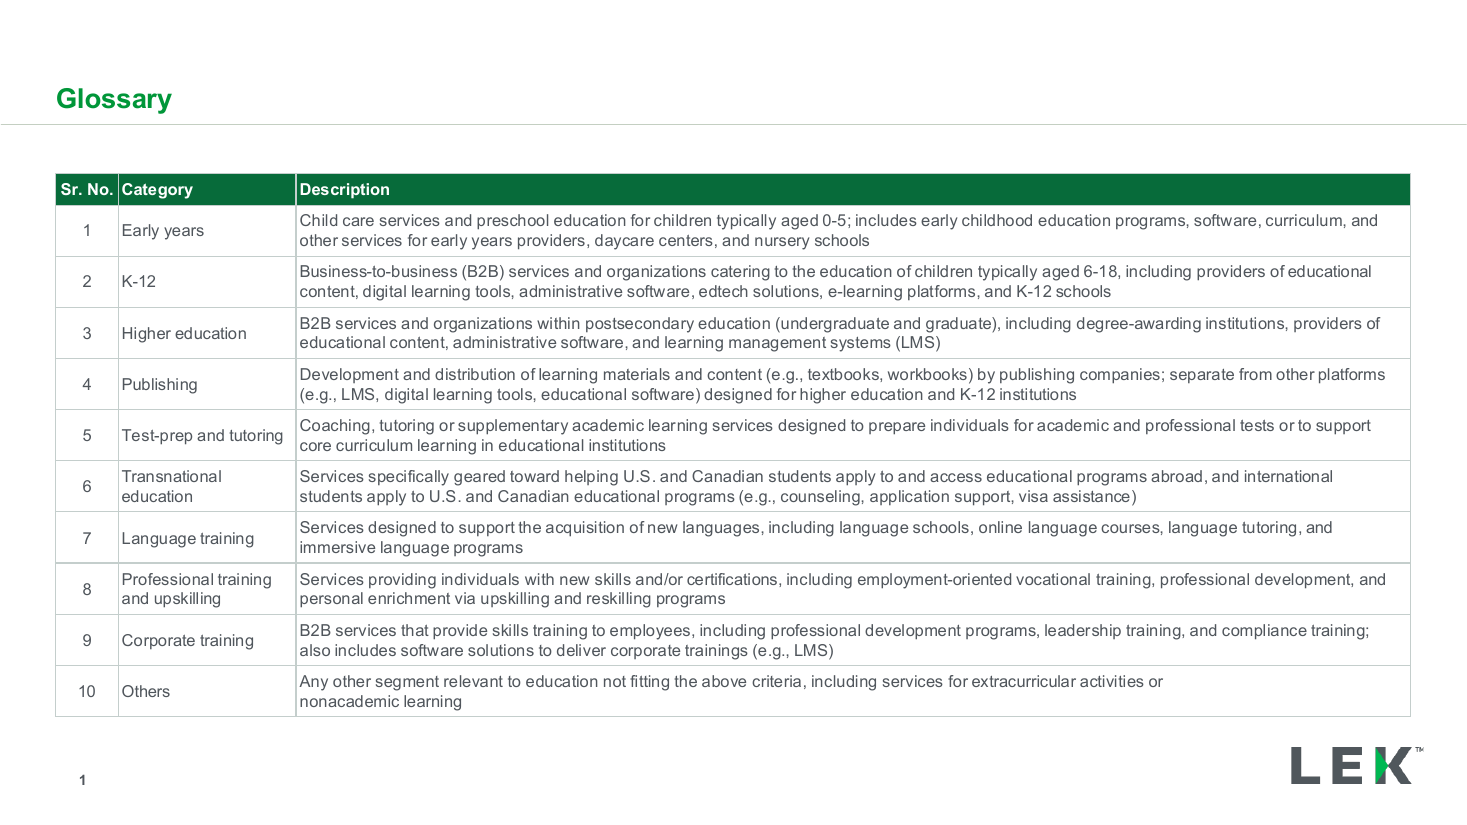
Segment glossary and category definitions table
data table
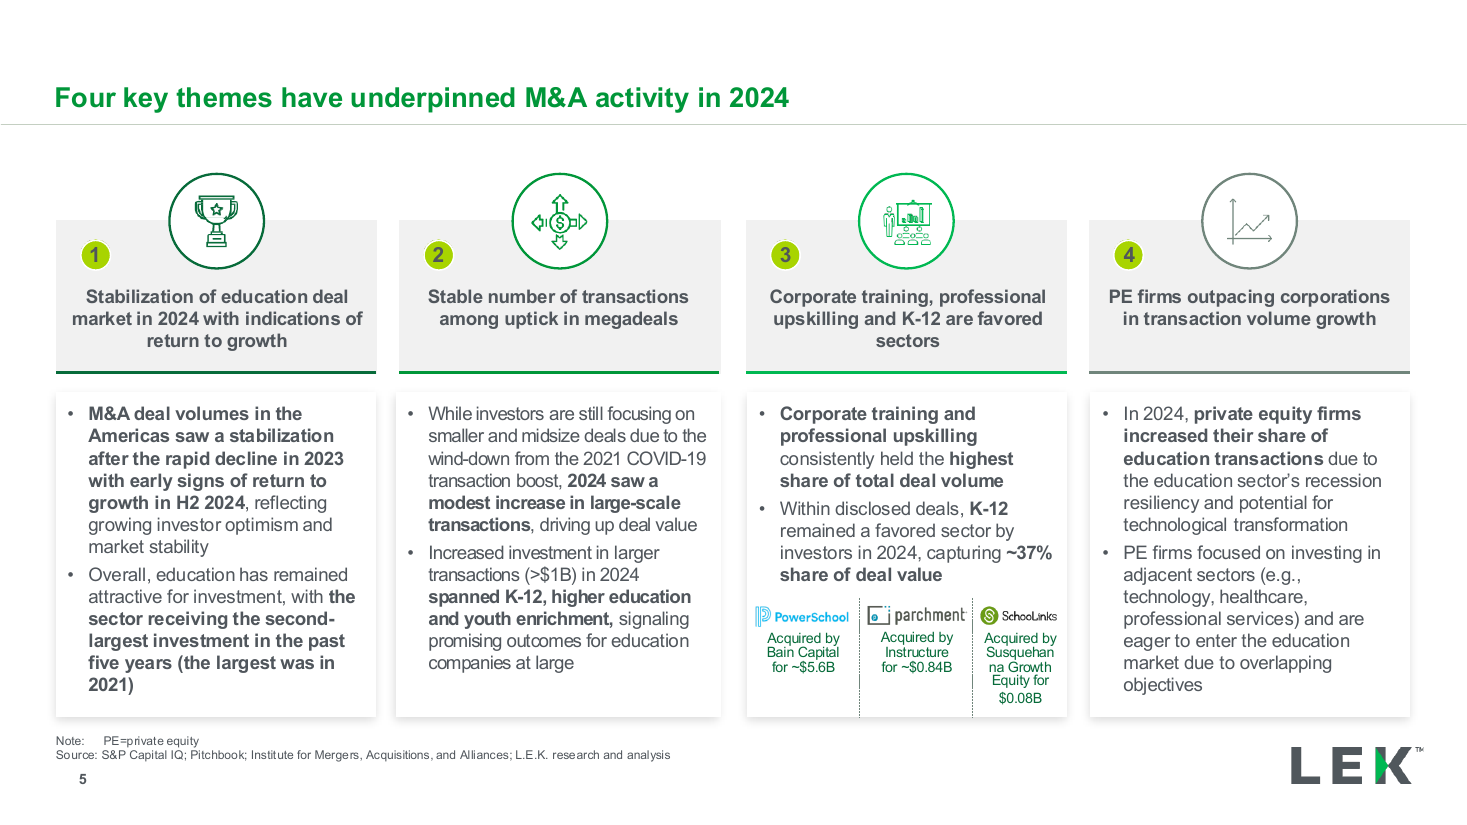
Four key themes executive summary
executive summary
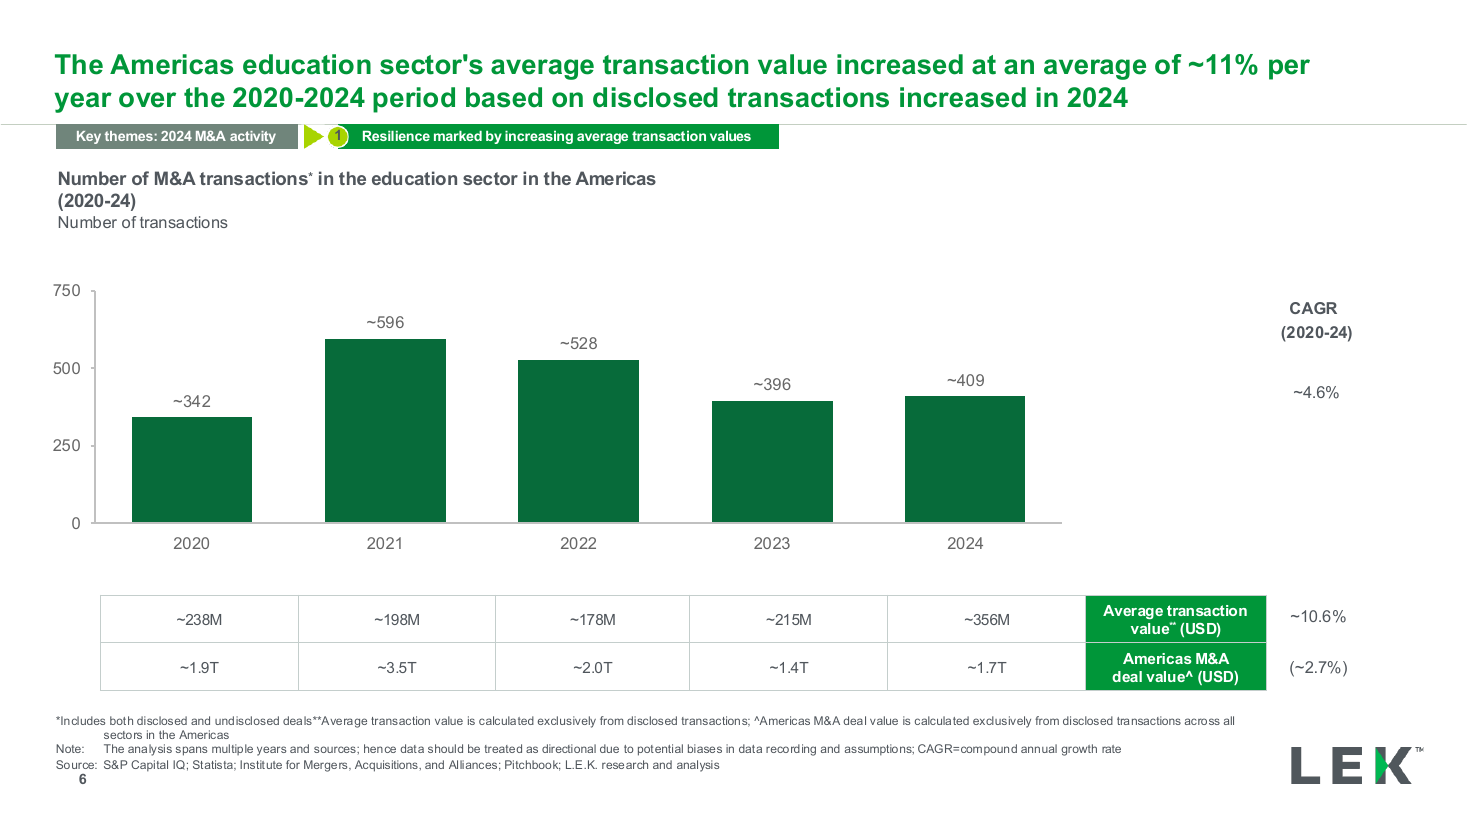
Deal volume by year column chart with CAGR
bar chart
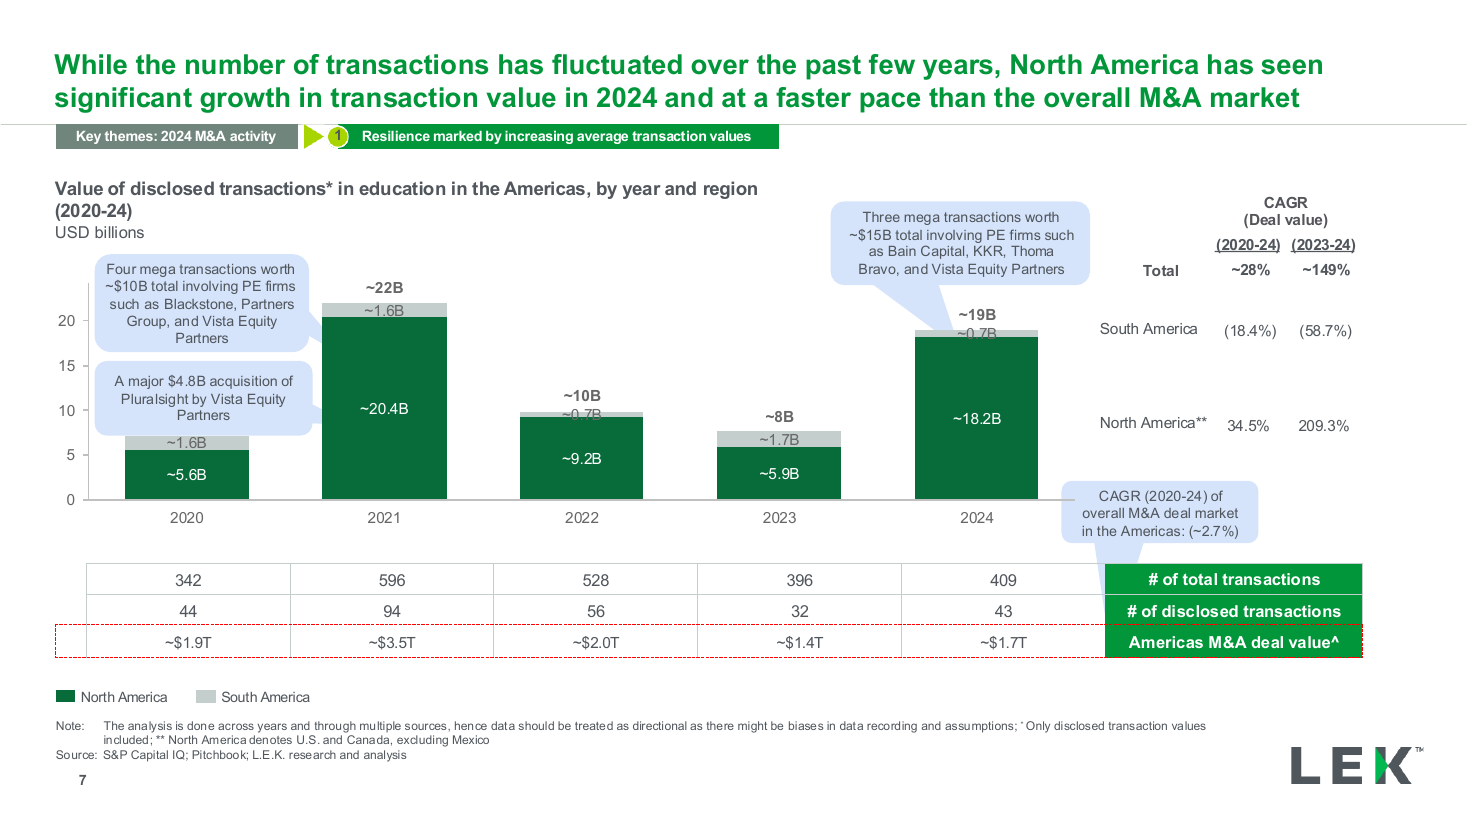
Deal value by region stacked column chart
bar chart
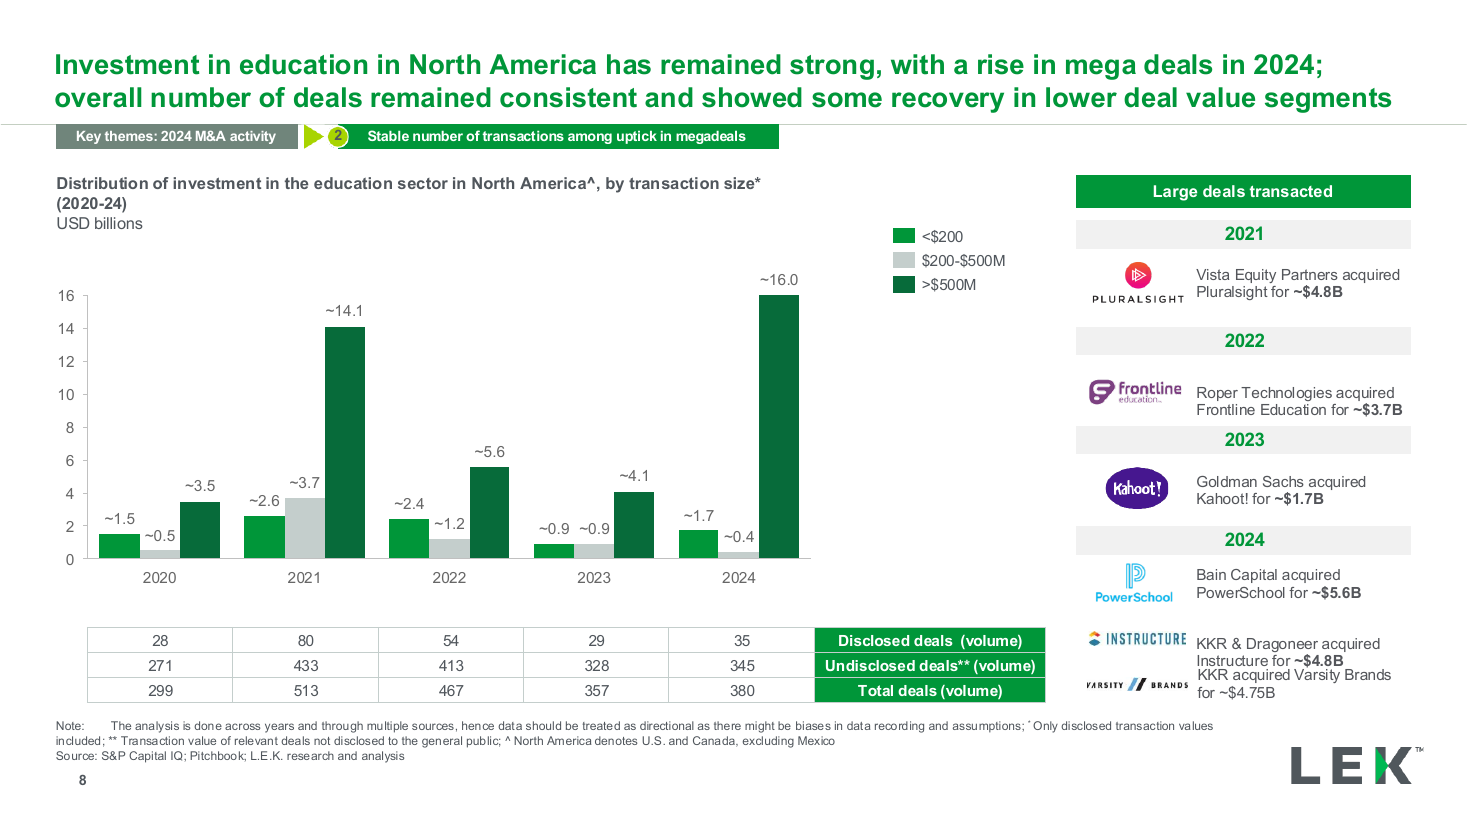
Investment by transaction size column chart
bar chart
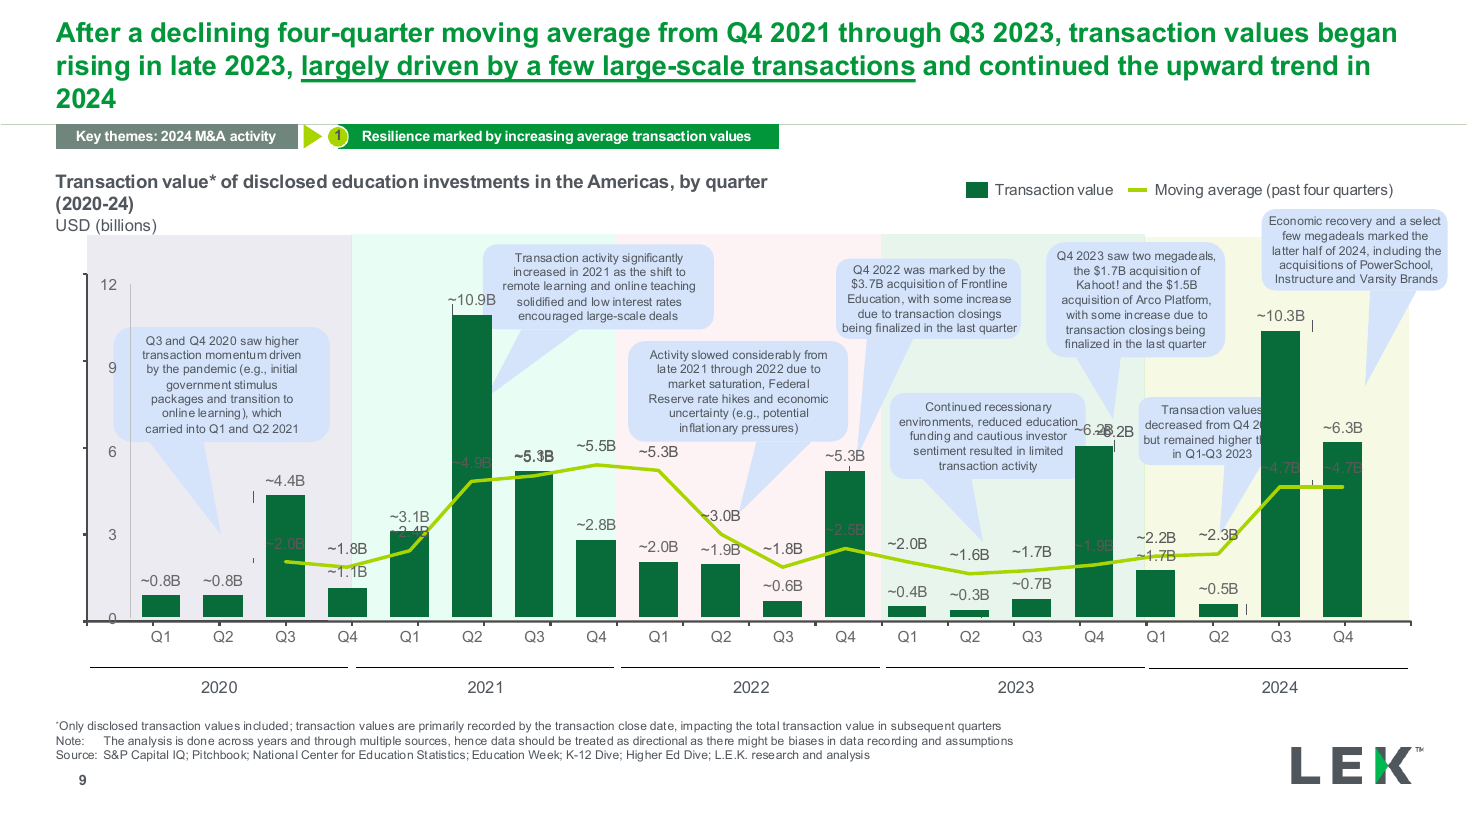
Quarterly value trend with moving average
text + chart split