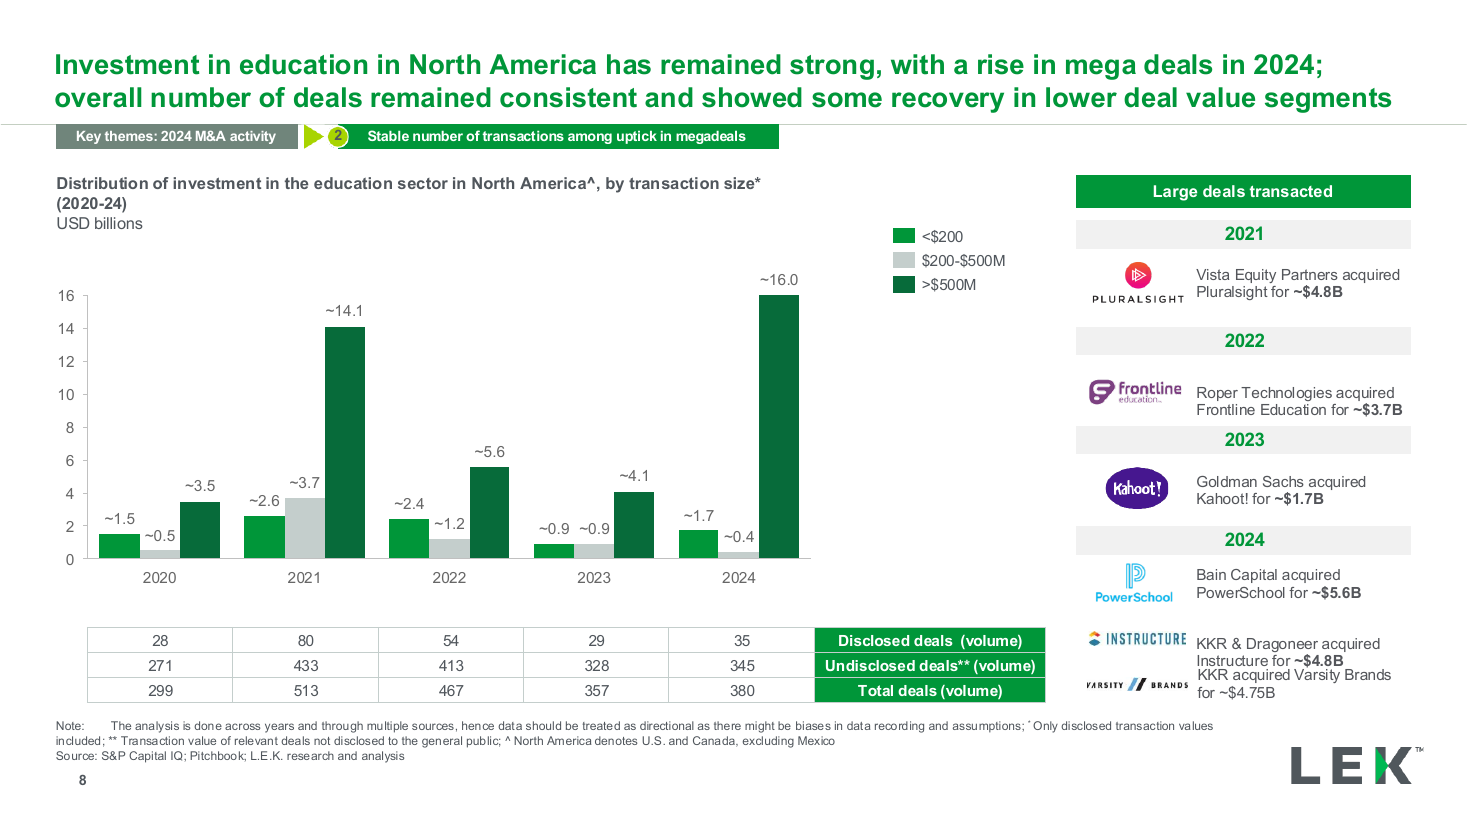
Investment by transaction size column chart slide template
A clustered column chart splitting yearly investment into transaction-size bands, with named large deals called out beside the bars. Use it to show how deal-size mix shifts over time and where the mega-deals land.
- Clustered columns banded by deal size (under $200M, $200 to $500M, over $500M)
- Disclosed and undisclosed deal counts noted per year
- Named large-deal callouts with acquirer and value
- Single takeaway header framing the mega-deal uptick
Recreated as a native, fully editable PowerPoint slide from page 8 of Education M&A Roundup 2024 and Trends for 2025, a publicly published L.E.K. Consulting deck.
More like this
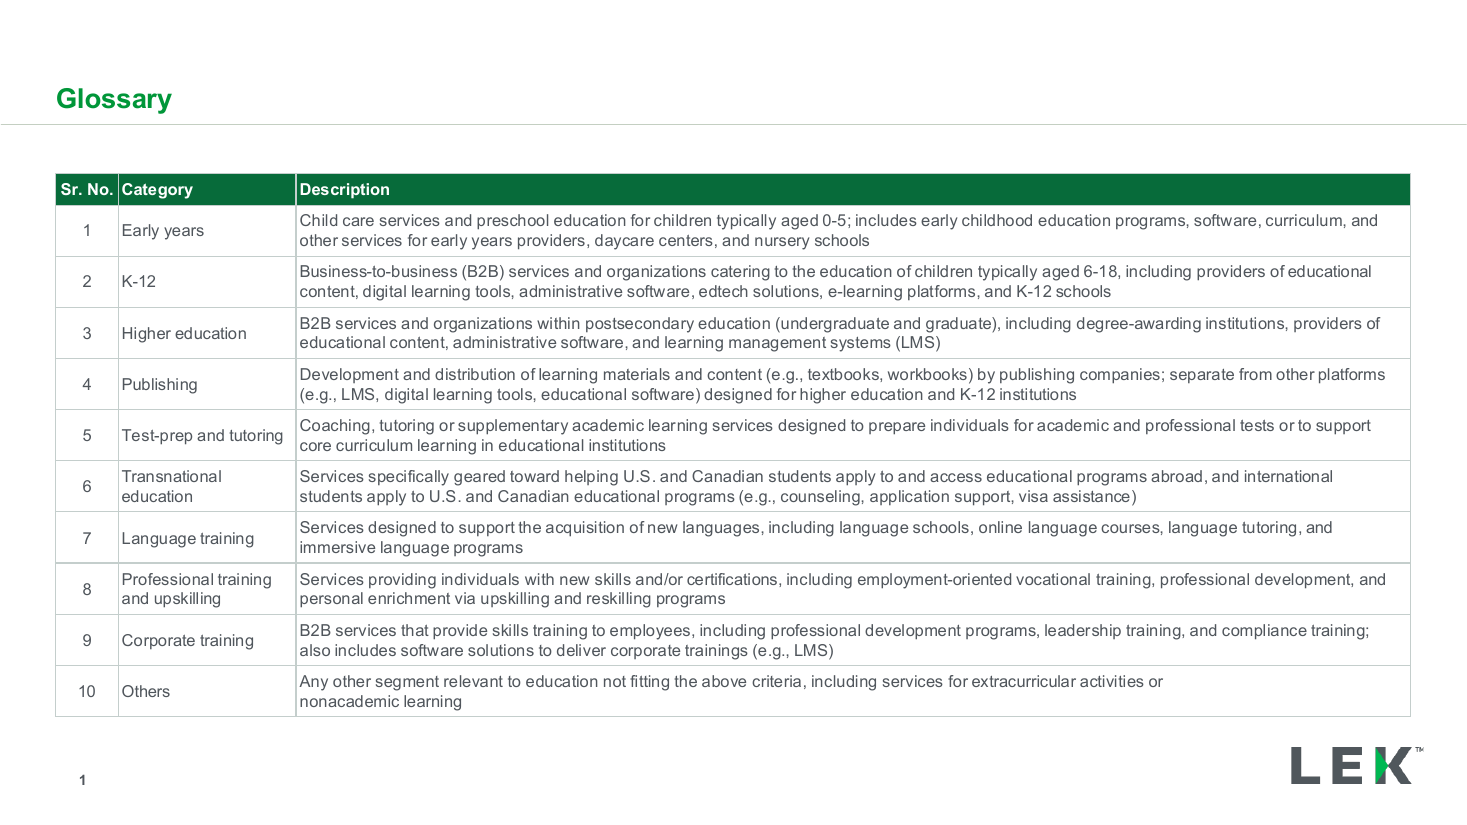
Segment glossary and category definitions table
data table
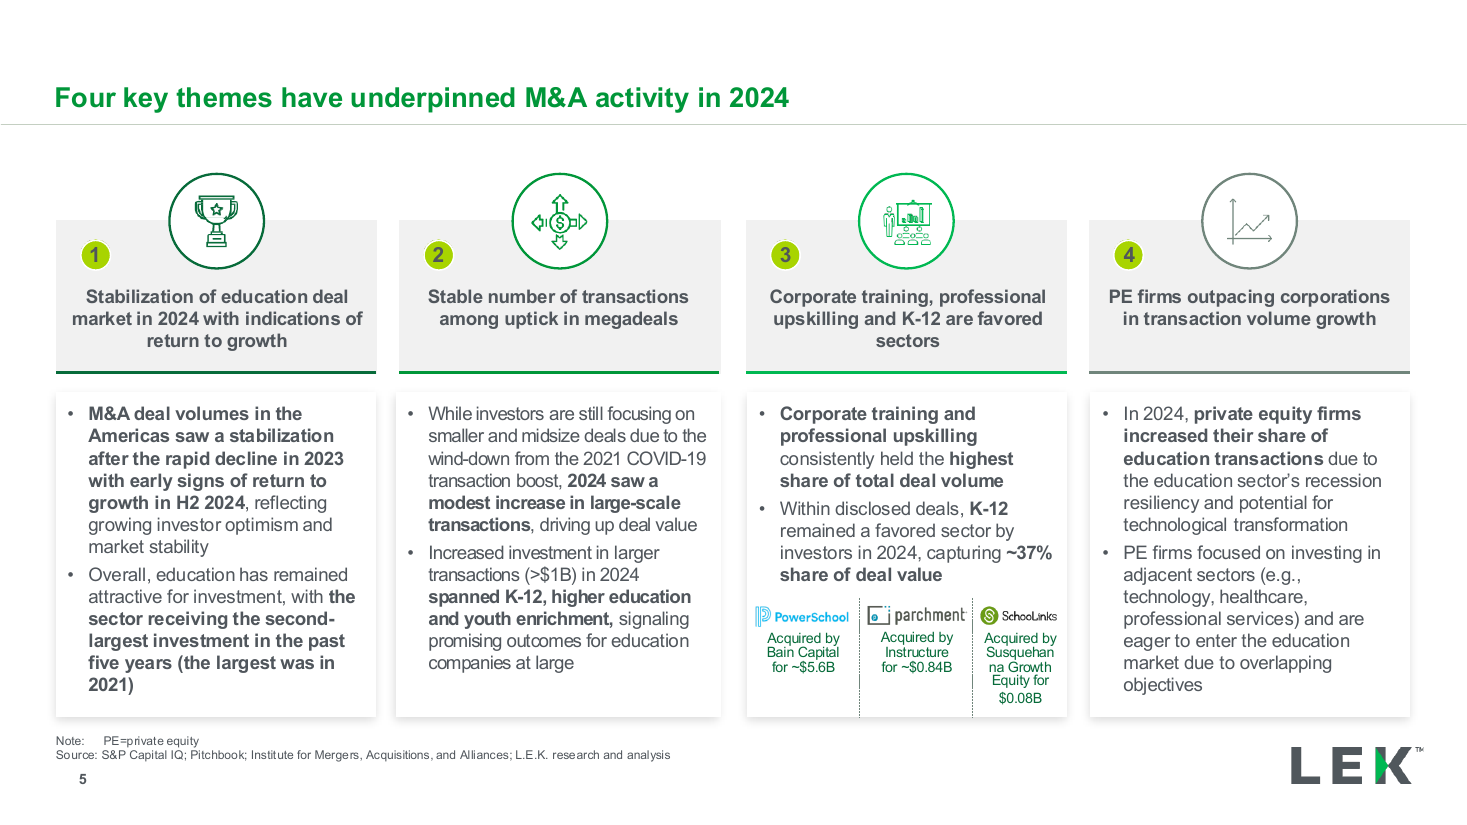
Four key themes executive summary
executive summary
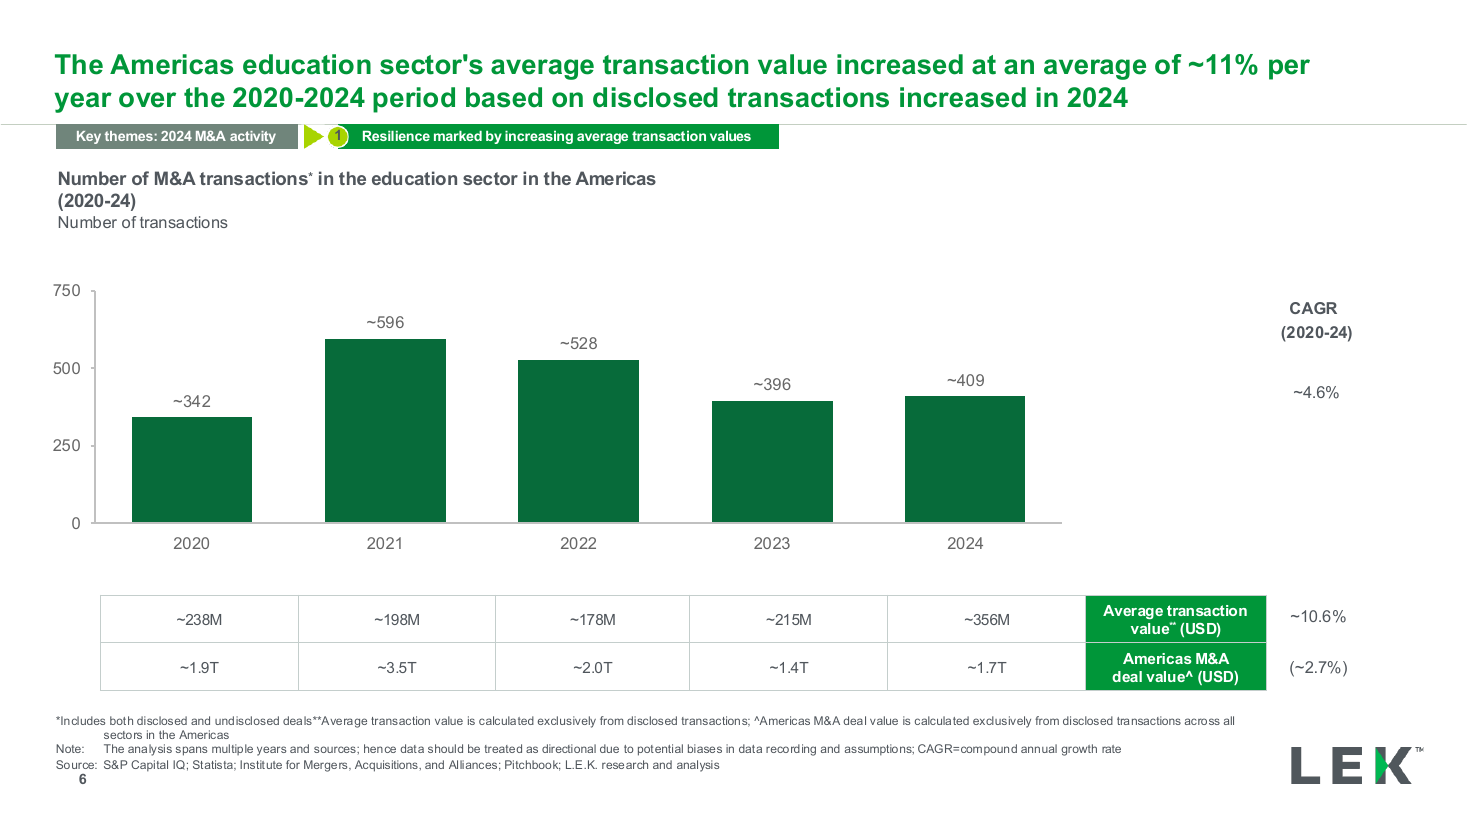
Deal volume by year column chart with CAGR
bar chart
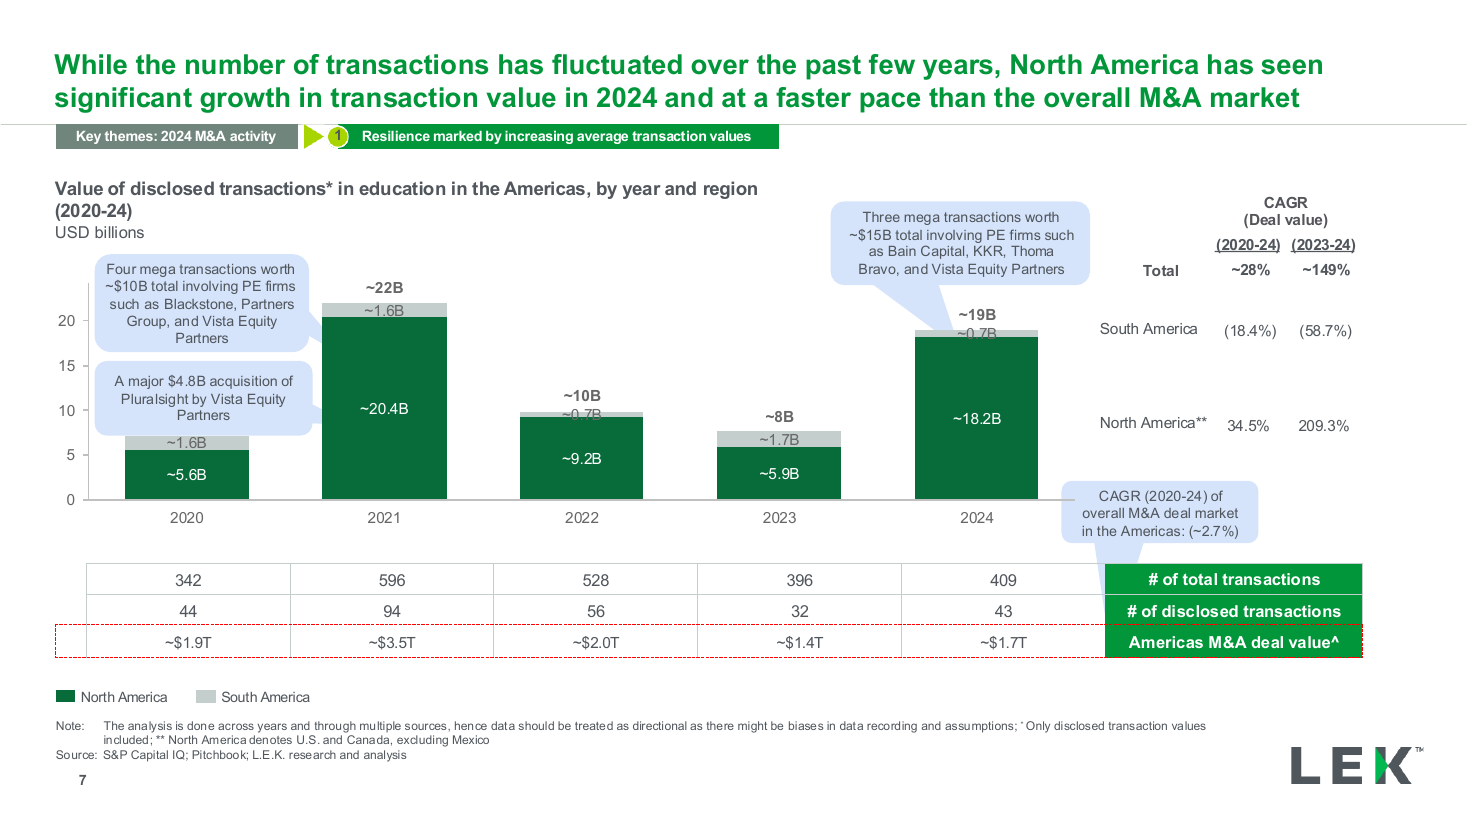
Deal value by region stacked column chart
bar chart
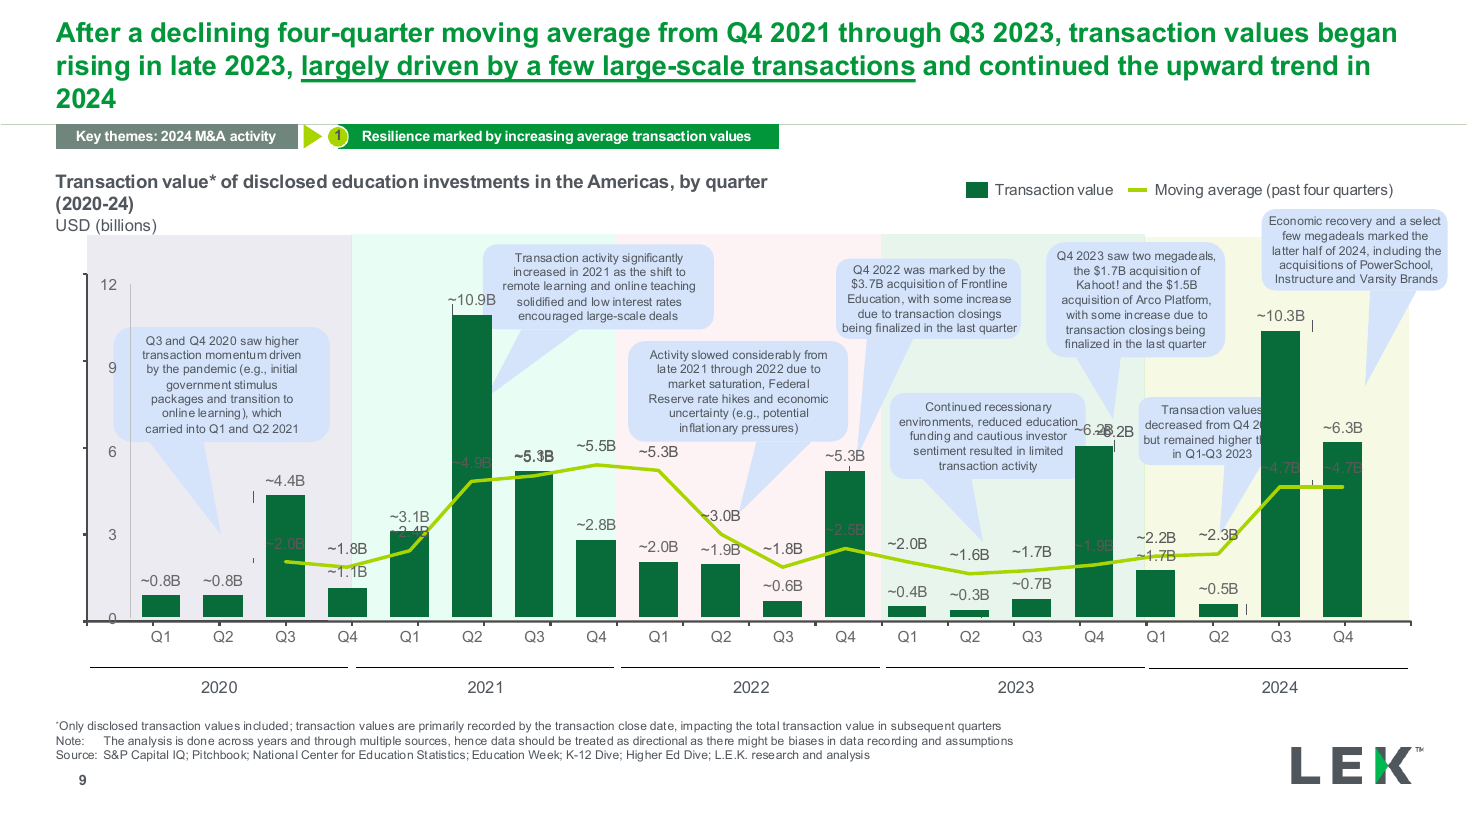
Quarterly value trend with moving average
text + chart split
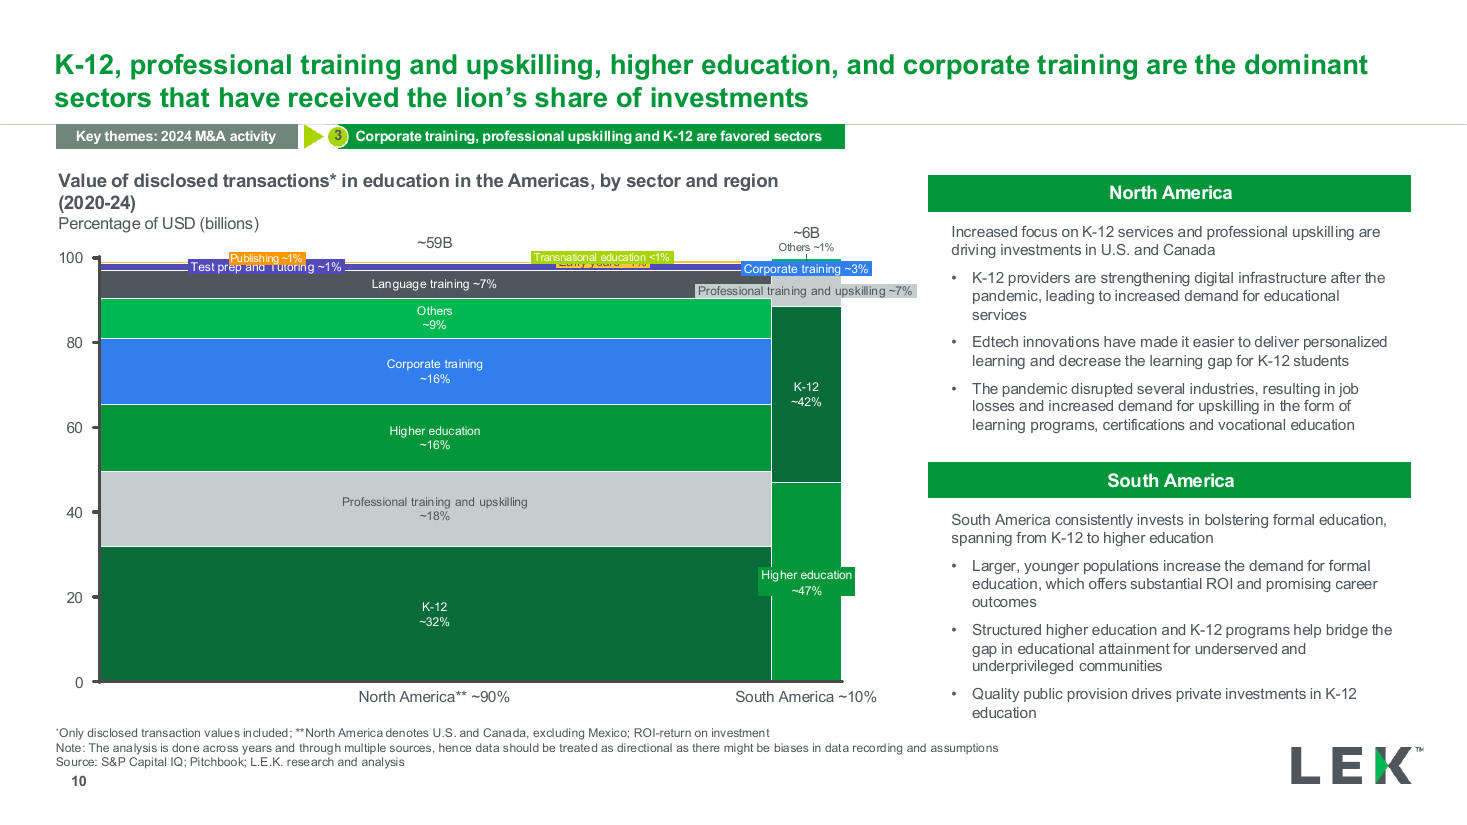
Sector share by region 100 percent stacked bars
text + chart split