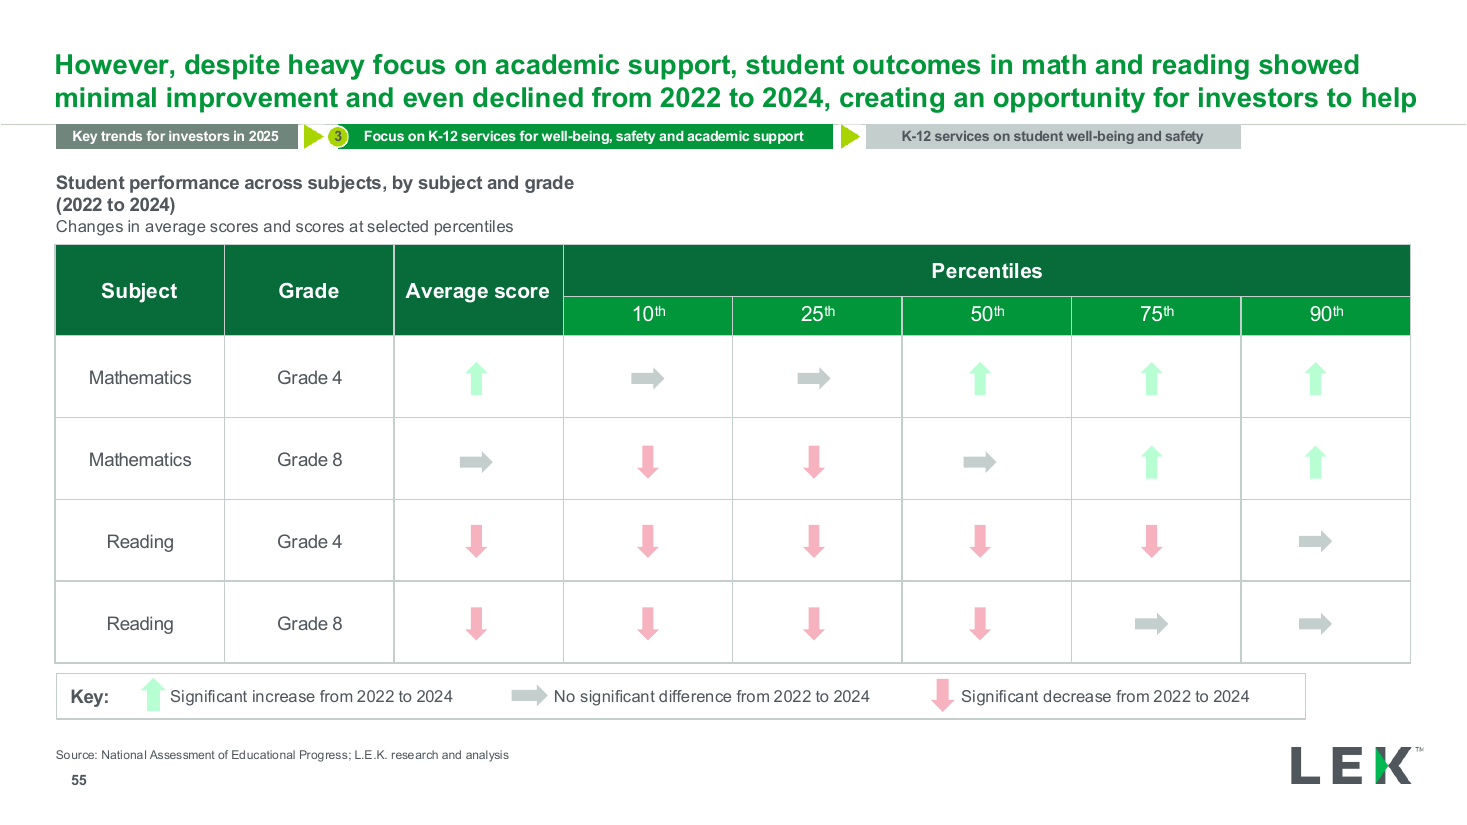
Performance change percentile matrix table slide template
A matrix table of score changes by subject and grade across percentiles, with a color key for significant increase, no change, or decrease. Use it to show many small directional results in a compact grid.
- Matrix table by subject and grade down the rows
- Percentile columns (10th, 25th, 50th, 75th, 90th)
- Color-keyed cells for increase, no change, decrease
- Direction-of-change legend
Recreated as a native, fully editable PowerPoint slide from page 53 of Education M&A Roundup 2024 and Trends for 2025, a publicly published L.E.K. Consulting deck.
More like this
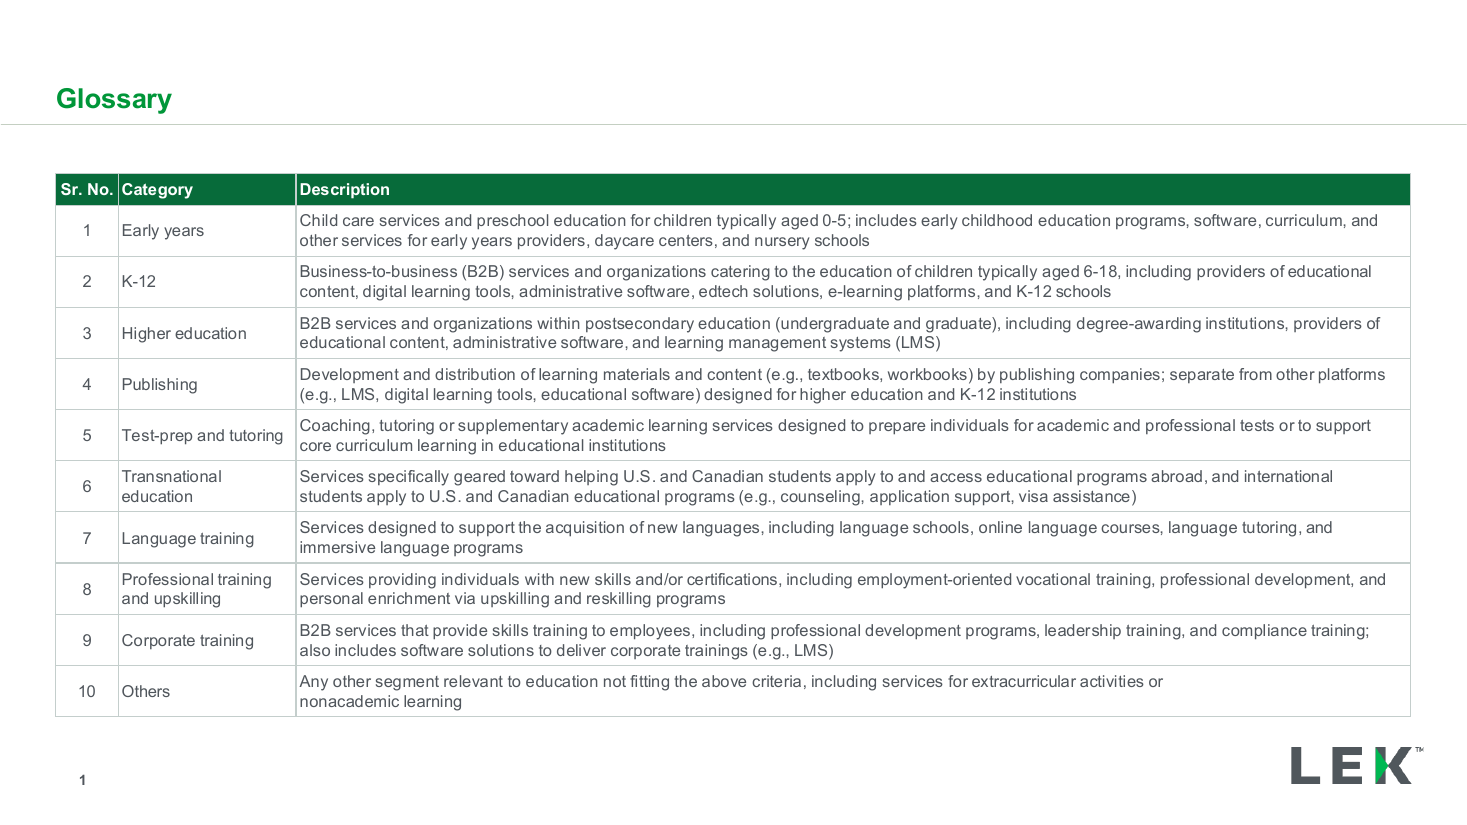
Segment glossary and category definitions table
data table
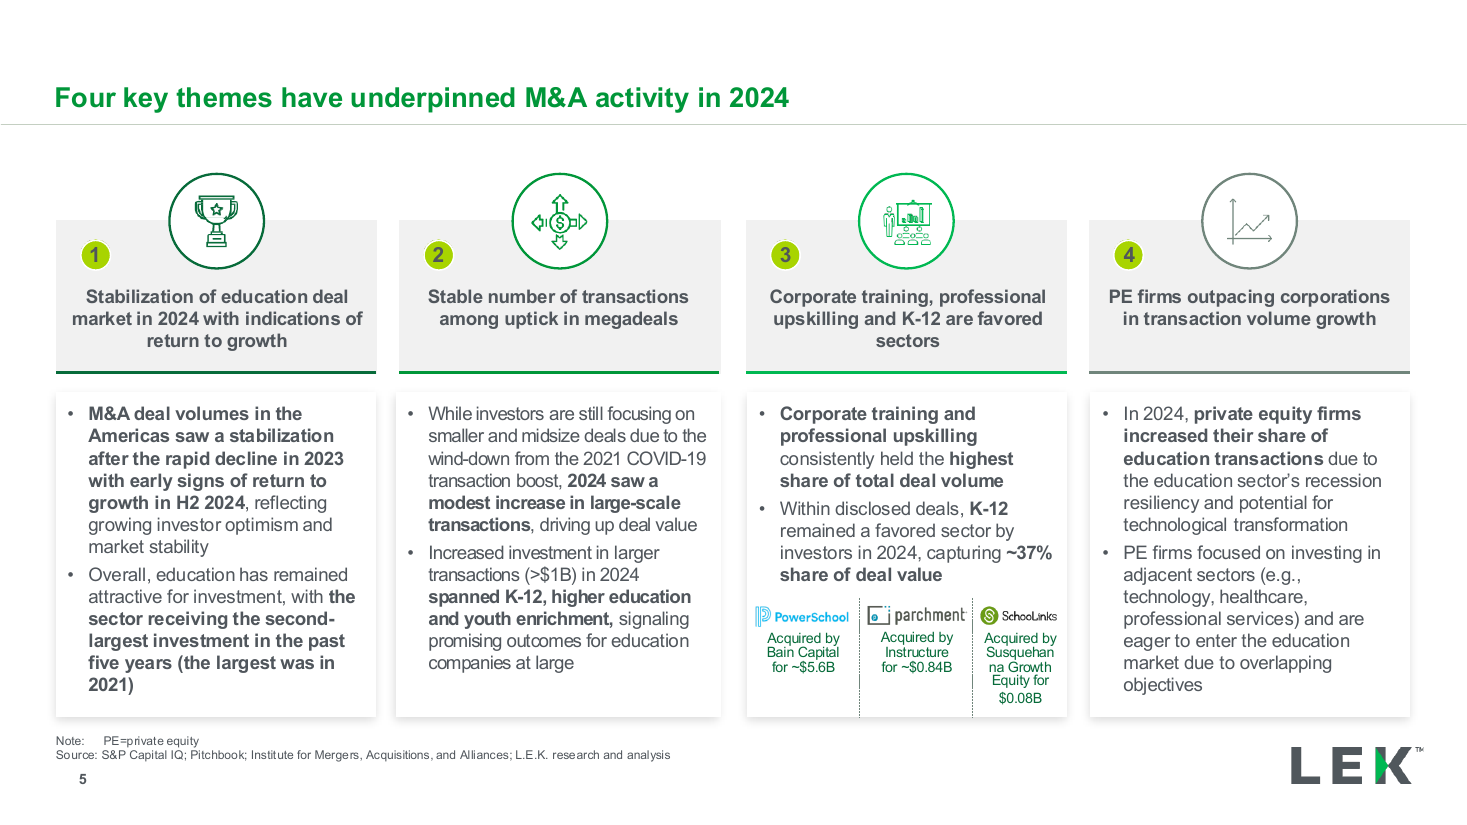
Four key themes executive summary
executive summary
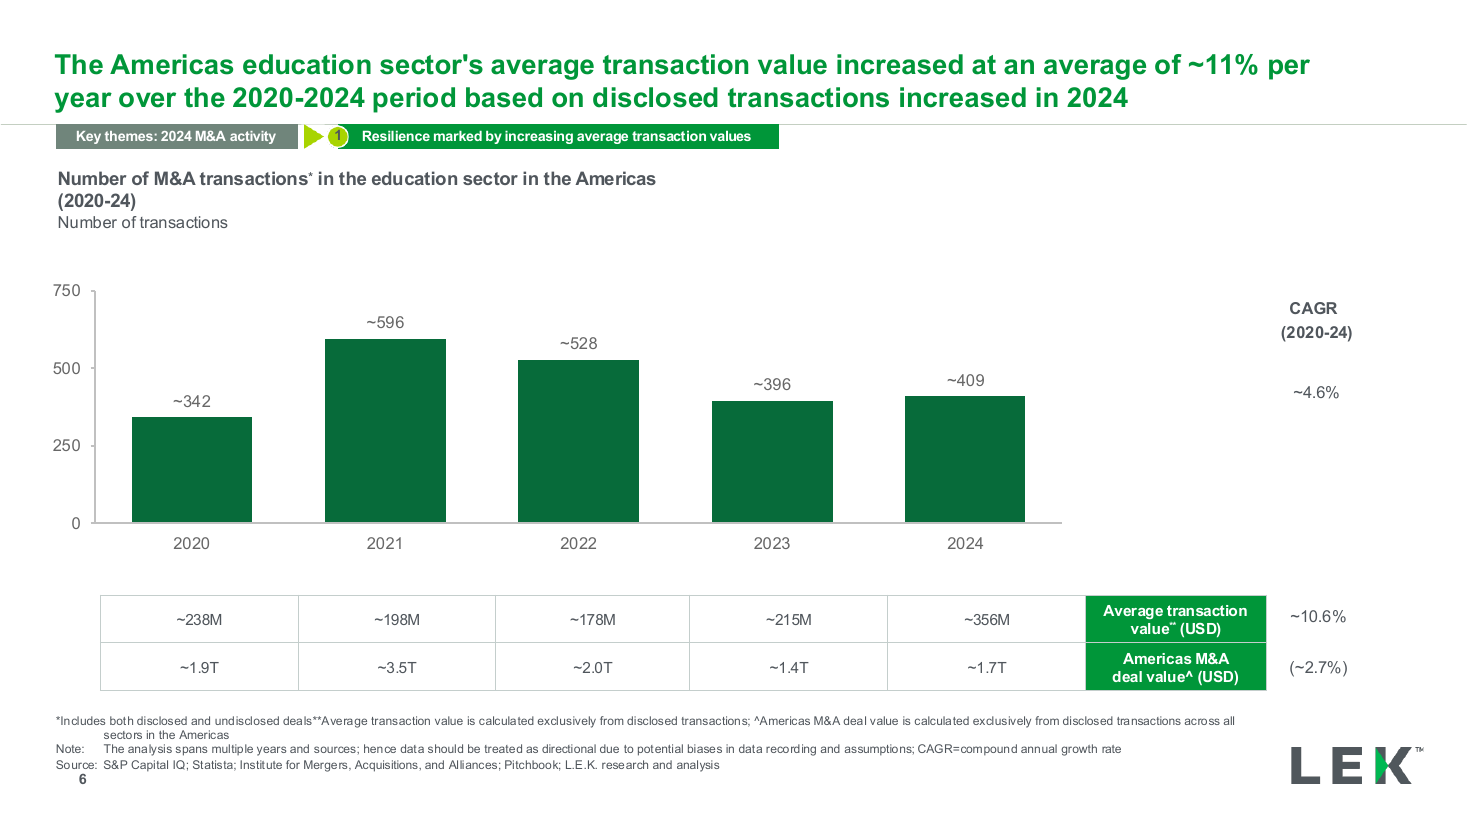
Deal volume by year column chart with CAGR
bar chart
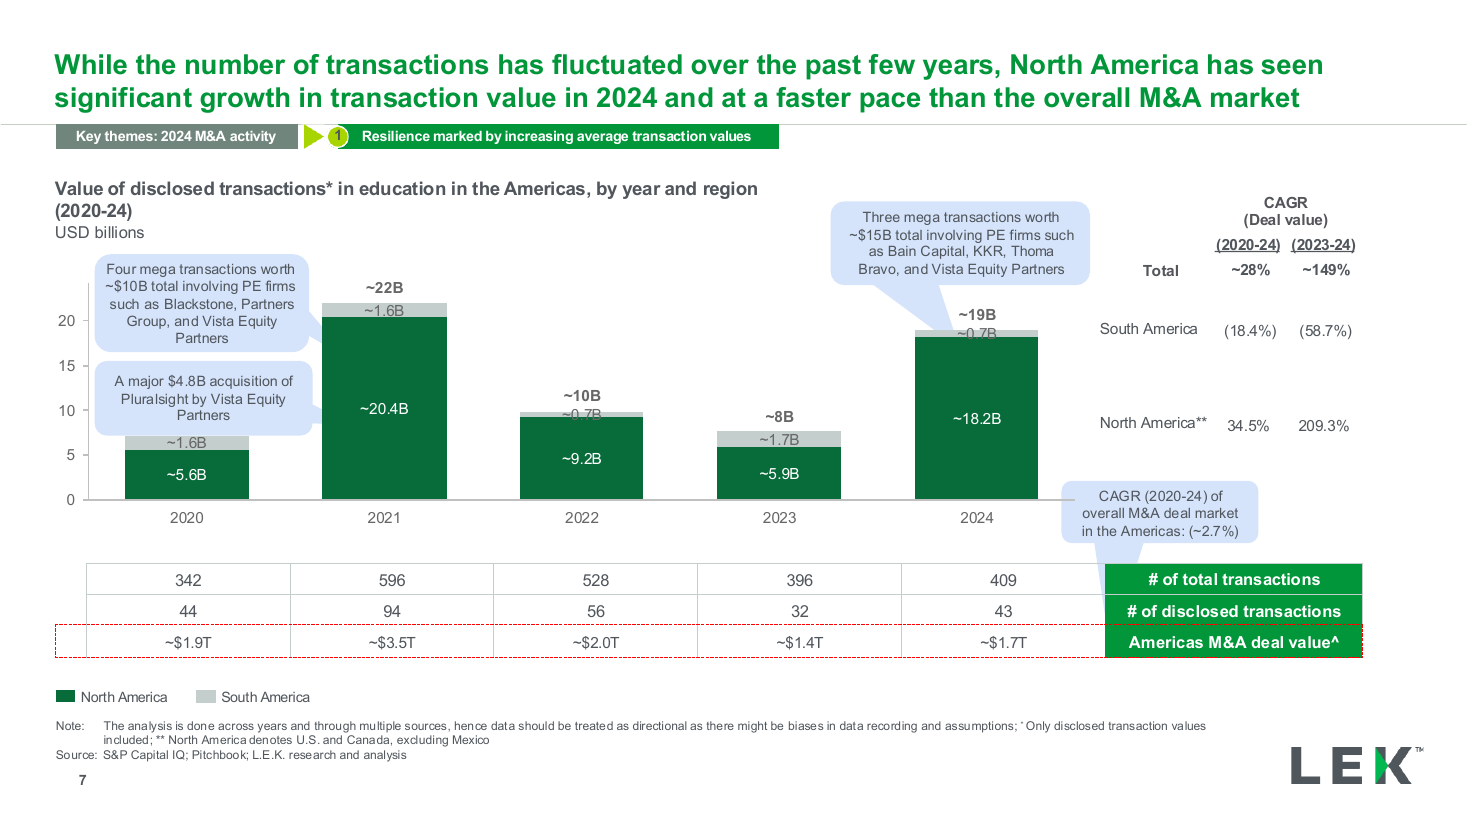
Deal value by region stacked column chart
bar chart
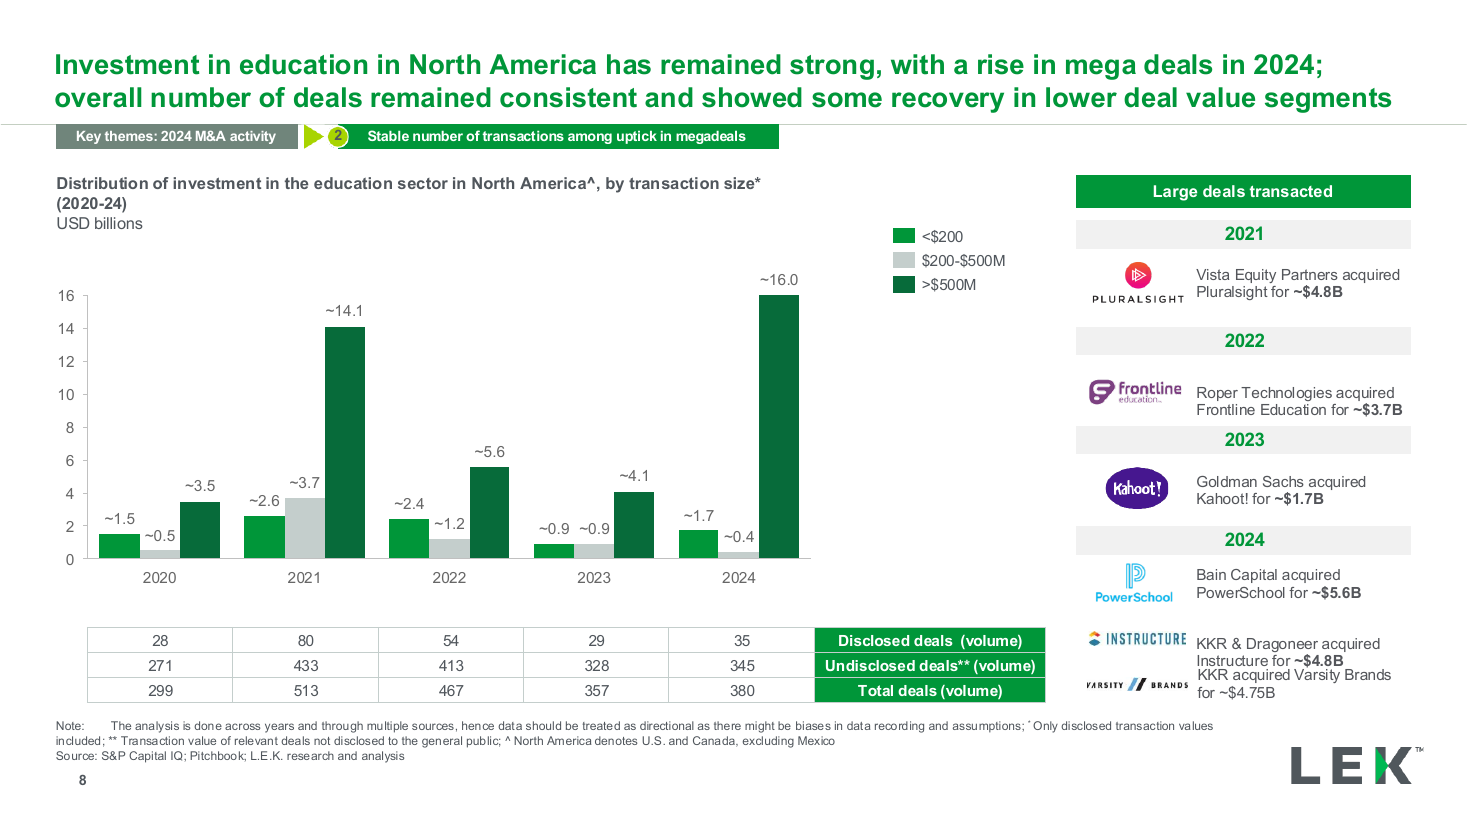
Investment by transaction size column chart
bar chart
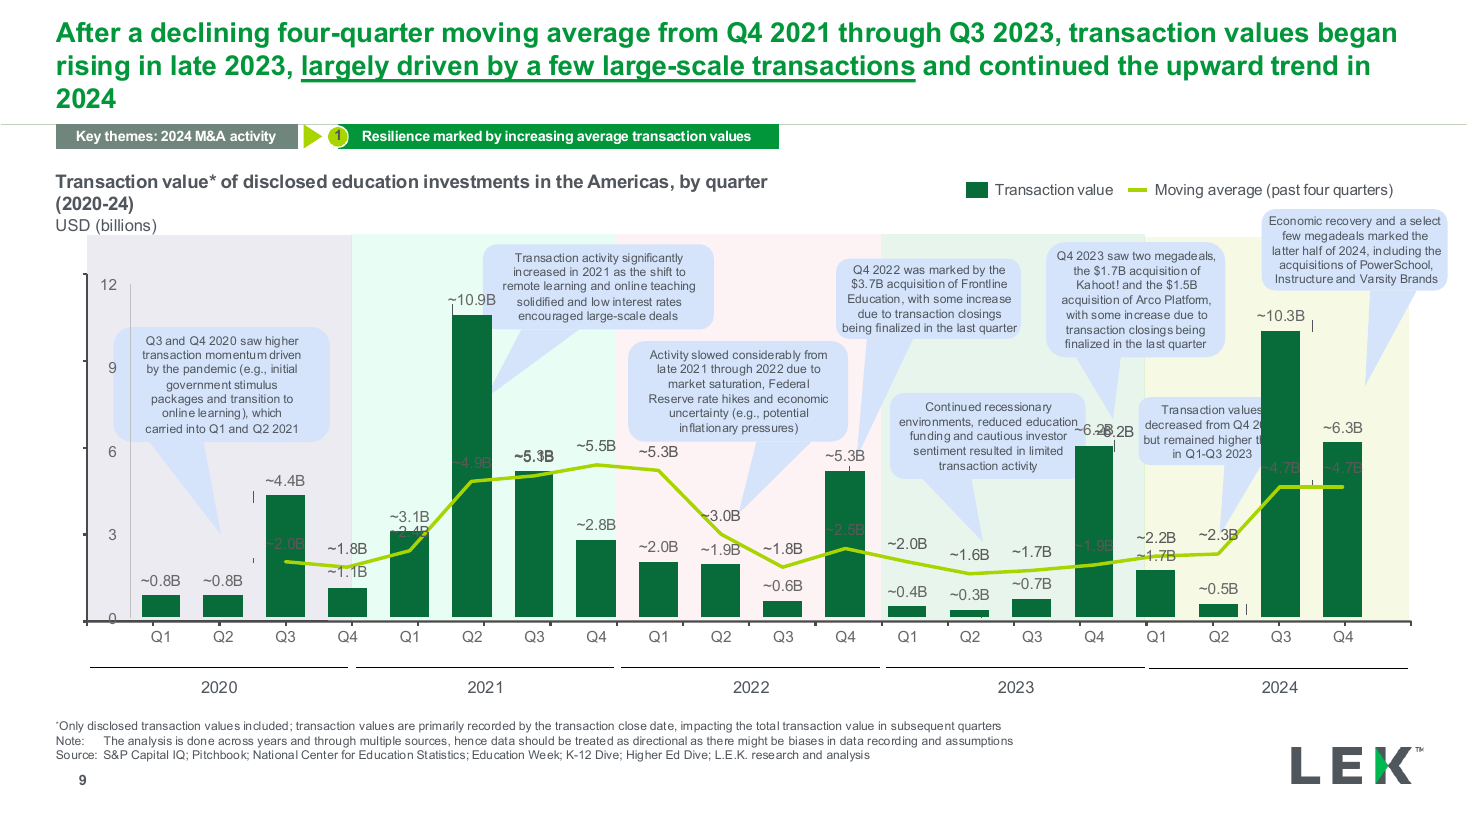
Quarterly value trend with moving average
text + chart split